What do your Facebook updates say about you? Intel has a cool way to find out–plus a $500 gift card giveaway!
As a frequent social media user (who isn’t these days?), I’ve often wondered about what all my tweets, posts, and status updates say about me. Personally, I’m hoping mine would be summed up with “fun, smart, and obsessed with Ryan Reynolds” but it turns out that’s not exactly the case.…
BY
Kristen Chase
·
As a frequent social media user (who isn’t these days?), I’ve often wondered about what all my tweets, posts, and status updates say about me. Personally, I’m hoping mine would be summed up with “fun, smart, and obsessed with Ryan Reynolds” but it turns out that’s not exactly the case.
If you’ve ever wanted to know the digital picture you’re painting of yourself–let alone your kids who are online (eep!) –we just found this amazing new tool from our sponsor Intel that’s beyond fascinating. Not only does What About Me? capture a snapshot of your social media life, but it also whips it up into a cool, customized infographic chock full of information about your digital habits.
You will not be able to resist, trust me.
{After the jump, check out my mildly embarrassing digital snapshot from What About Me?, plus an AMAZING $500 gift card giveaway for one lucky Cool Mom Tech reader after the jump!}
If you’ve got a few minutes to spare, you can create a custom What About Me? infographic using their digital tool. Give permission, and the tool will take a peek at your Facebook account, as well as Twitter and YouTube if you choose, and provide you with a colorful infographic that you can can save, share, or hide forever in shame. (Ha.) Keep in mind, it’s definitely heavier on the Facebook results.
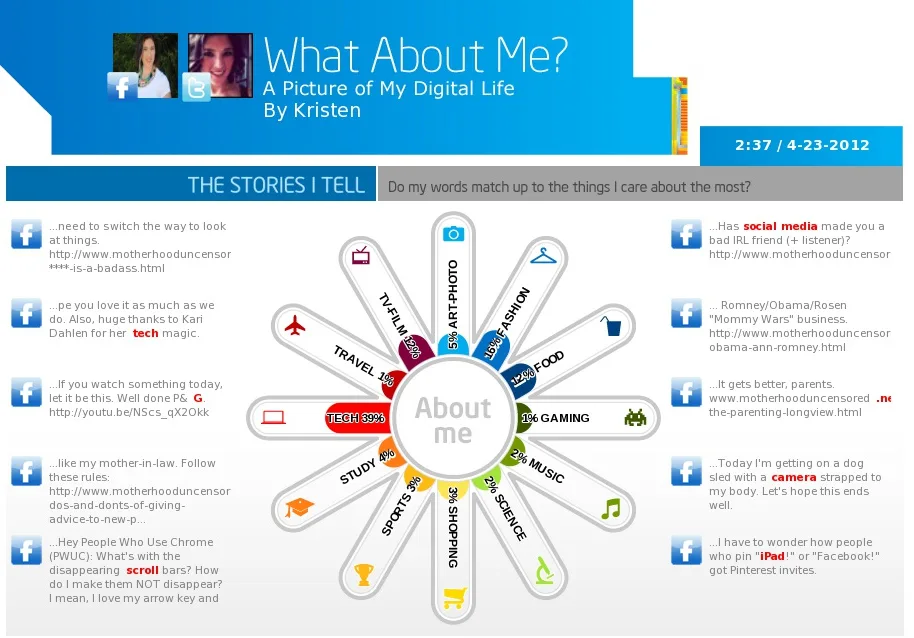
As it turns out, I post most about tech (39%), which isn’t completely surprising considering–well, here I am. Talking about tech. However, since What About Me? only accesses your personal social media info and not any fan pages you might have, it’s clear my work with Cool Mom Tech is rubbing off on me. Note to self: Post more about Ryan Reynolds.
Fashion was a distant second, in case you’re wondering. Hey, at least I’m somewhat diversified.
It’s also really cool to see how What About Me? breaks down the way you’re interacting with social media. Apparently I’m a big sharer of links and the work of others, but not a big “liker.” Maybe it’s the old school blogger in me who prefers comments over likes, or that I’m a bigger Twitter user than Facebook. But I’m definitely going to try to offer a few more likes now that I’ve seen this information.
Also it tracks when you’re using social media most, and it turns out I’m not the night owl I had imagined myself to be. Evidently I have a stellar opportunity to dial up the commentary during Real Housewives episodes.
Finally, I definitely appreciated the snapshot of who I’m interacting with and whether we’re alike. It’s no surprise that my Cool Mom Picks partner Liz is someone I engage with on a frequent basis, as well as my sister-in-law and my neighbors. And in a weird, useless but totally fun bit of trivia, it turns out that two of the people I chat with most happen to be my same astrological sign.
For the few moments it takes to try out the What About Me? app, the information you’ll get about your habits is intriguing and super fun. And while it might not necessarily change how you use Facebook, Twitter, and YouTube, it definitely offers you a glimpse into how you’re using it in a way I’ve never seen before. And let’s just say it’s an interesting glimpse into how your kids are using it too; should they be daring enough to try it out and show you the results. –Kristen
** Update: This contest is closed! We will announce the winner soon. **
EXTRA COOL: WIN IT! Our sponsor Intel is generously offering up a $500 Best Buy gift card to one lucky Cool Mom Tech reader! Maybe so you can grab a shiny new laptop or tablet and start fresh with your social media habits?
TO ENTER: Make your own What About Me? infographic, AND then leave a comment telling us the 3 topics you post most about and their percentages. Pretty easy for a $500 gift card, huh? You have until SATURDAY 4/28 at midnight PT. **The winner will be required to share the infographic with us to confirm eligibility. (Don’t worry, we won’t post it.)
FOR ONE EXTRA ENTRY: Share the link to this post on Twitter (you must include @coolmomtech – and make sure you’re following us!) and link to it in your comment below. Please see our general contest rules for more details.
For more awesome prizes, you can join in the #SocialButterfly Twitter party hosted by our own @techmama and @littletechgirl on Monday, May 7 at 8pm EST.
Fashion (21% – this seems to mostly come from posts where I use the word “pretty.” In a lot of cases this isn’t related to fashion.)
Food (20% – no surprise)
Study (19%)
This was WAY COOL! Love it and have shared it! My top three were (no surprise here) TECH-FASHION- FOOD! Im sure if shoes were broken into their own category, it would top FASHION! :))
Funny because I post about exercise almost 100% of the time but that wasn’t one of the things it picked up. I saved it to my facebook wall so I can find the link when I WIN. 🙂
Interesting… Food, 24% (all those recipes I suppose); Art/Photography 11% (I’m a graphic designer, so not surprising); Fashion 11% (What? I post about fashion? Does this include the complaint about my kids not wanting to dress warmly?). This is neat, thanks for sharing. ~jm
Fashion (24%), Food (23%), and Art/Photo (15%). Of course, it failed to pick up on the fact that 100% of the items it calls “fashion” were only in fashion 100+ years ago… I’d class them as “study.”
Pretty cool, Intel! Thanks Coolmom for the heads up on this cool app and for the chance to win $500. Awesome stuff for a Friday 🙂 Definitely sharing with friends.
Fashion – 26% (surprising)
Food – 20%
Art-Photo – 18%
I guess they don’t have a “family” category, because I think I definitely talk about my DD the most!
Wow, that was interesting! My top interest is fashion at 33%, followed by food at 17%. Study and Art/Photo are tied for third at 13%. Thanks for the opportunity!
Tech 20%
Gaming 17%
TV-Film 12%
Hi coolmomtech! Fits me perfectly! I’m always tweeting about technology, programs, apps, and playing with my little guys! Intel has me pegged!! 😀
LOL, def says me! Not surprised food is #1, actually thought it would be a higher percentage though. phew! Wish I had more in the tech and fashion category. Guess I’ll have to work on that!The sports being #2 is from being a mom of boys! The #3 photo is being a mom and showing photos I guess 🙂 This was fun, thanks cool moms for showing us.
I post mostly about food (27%), fashion (24%) and art/photo (13%). I was a little surprised about the food, but it seems like most people have food in their top 3. I am completely floored by fashion being #2! I am terribly unfashionable:)
Tech – 20%
Food – 14%
Fashion – 12%
Am I surprised? Yes, about the “Fashion” stuff. I’ve got a three-way tie for 4th place: 10% each to Science, Sports & Travel. I would have pegged any one of those three higher up on my posting scale than Fashion (yikes!).
 As a frequent social media user (who isn’t these days?), I’ve often wondered about what all my tweets, posts, and status updates say about me. Personally, I’m hoping mine would be summed up with “fun, smart, and obsessed with Ryan Reynolds” but it turns out that’s not exactly the case.


Leave a Reply